Finzops
Data Visualization | User experience
The primary objective is to evaluate the existing end-to-end process, identify areas for improvement, and enhance the methods of sharing valuable data while automating tasks and activities. We developed a design solution through a comprehensive understanding of the actual user problems, actively participating in the creation and execution of the design strategy.
PROBLEM STATEMENT
The organization's current method for setting targets and collecting projections is highly manual and inefficient. This repetitive cycle of communication between target setters and account leads, where account leads negotiate their expected collections with the target set, leads to frustration on both sides and slows down the entire process.
MY ROLE
I partnered with a team of five to revamp the existing system. We began by conducting user research with various stakeholders to understand their needs and challenges with the current process (as-is). By incorporating their feedback and addressing their pain points, we developed wireframes. We then iterated on these wireframes with the stakeholders' input to ensure they met their requirements. Finally, the finalized wireframes were transformed into the final user interface (UI) design. To guarantee a high-quality product, we conducted thorough Quality Assurance (QA) testing before delivering the final screens
PROJECT TIMELINE
July, 2021 - March, 2022
(8 months)
CHALLENGES
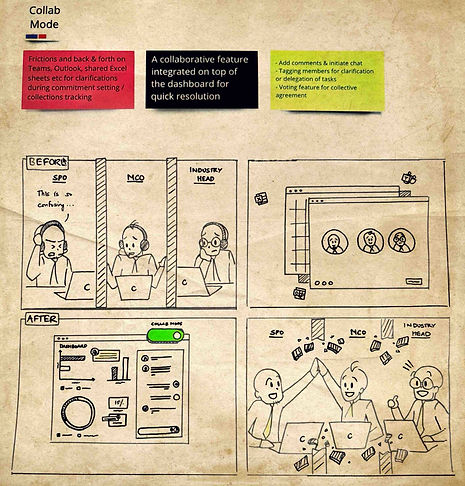
Our current data landscape is siloed across various systems, causing friction, inefficiency, and frustration for teams. Combining this data for meaningful insights is a time-consuming manual process, hindering collaboration across teams.
Challenges with time management lead to a backlog of unexpected invoicing delays, which can negatively affect revenue collection on time.
Many moving parts and uncertain business factors can affect our ability to meet commitments
Hybrid work nature with multiple enterprise technologies
USER GROUP
Key Account Manager
Portfolio Owners
Operations Manager
Operations Director
KEY INSIGHT FROM PERSONAS

Target numbers seem too ambitious

We are forced to
do effort confirmation by 25th of the month

Just because clients paid before,
will they pay in next quarter too?

If I commit higher and don't reach it by EOQ, I get into trouble

Conflict with finance team when failed to meet collection targets
No view of the performance of the top accounts in the portfolio
Inefficient reviews with Key Account Managers due to scattered and incomprehensive
Inability to monitor collection
pace
Effort-intensive due to multiple disconnected platforms such as Outlook, shared Excel Sheets, Phone calls and Offline discussions
Difficult to keep a track of communication history and decisions
USER STORY


Wireframes

Provision for Key Account Manager to not only update commitments/adjustments on the go, but also view immediate implications of these changes on key metrics and make amends if needed.
A visual status of goal metrics together help the Key Account Manager weigh up the commitments and collections against the target.
A visual representation of goal metrics empowers Key Account Managers to compare commitments and collections to their targets.
Breaking down target numbers provides transparency and helps Key Account Managers understand the rationale behind their goals.
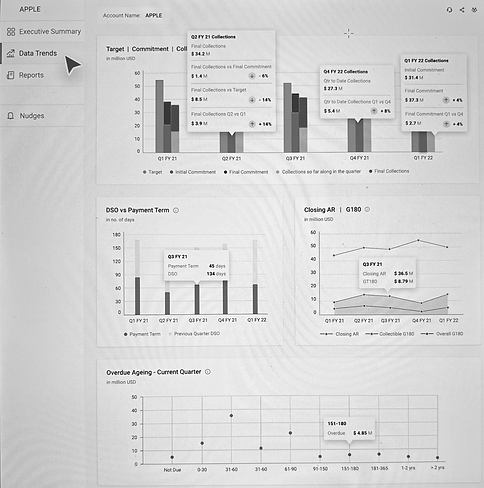
By visualizing collection trends over the past 4 quarters, Key Account Managers can identify patterns in their commitments and collections, enabling them to make adjustments as needed
By analyzing trends in Days Sales Outstanding (DSO) compared to payment terms, Key Account Managers can gain insights to predict client payment likelihood and timing for an account.
By analyzing trends in GT180 prompts over time (quarter-over-quarter), Key Account Managers can gain insights to improve their collection potential forecasts.
Overdue ageing likely refers to invoices that have been outstanding for a longer period than usual or past the due date. The specific ageing categories will vary, but they often group invoices into 30-day buckets (e.g., 30-60 days overdue, 60-90 days overdue)

Calculation of weighted average Days of Sales Outstanding (DSO), considering the value of each invoice, to evaluate the segment's collection efficiency and its impact on overall financial health.
This allows us to sign off on all the commitments associated with the entire portfolio.
If commitments to a portfolio seem low, the Operations Director can investigate the specific account shortfalls
This widget allows the Operations Director to easily connect with the portfolio owner for a quick discussion to ensure they're aligned on the commitments
Seeing the performance of multiple portfolios side-by-side gives the Operations Director a quick overview of each portfolio's collection potential. This allows for early identification of any shortfalls and timely action to address them.


Note: Due to the confidential nature of the projects, our NDA restricts us from sharing all the details. To protect client confidentiality, the NDA we signed limits the level of project detail we can disclose.


Wireframes -Mobile View


TAKEAWAYS
Empowered with insights and information
Focus on driving timely actions and outcomes
Quick identification of hot spots
Identifies and implements process improvements
Drives benchmark performance